Once your Visual Studio solution starts growing, it often ends up integrating some maybe less than standard ways to do something. For example you introduce some custom MSBuild steps, output multiple projects to the same directory, or have things like WiX projects in your solution. Understanding what is actually going on when you build the solution can become quite tricky.
I recently came across MSBuild (Structured) Log Viewer, which is able to read the binary log files that MSBuild can generate, and visualizes as collapsible tree with filtering functions.
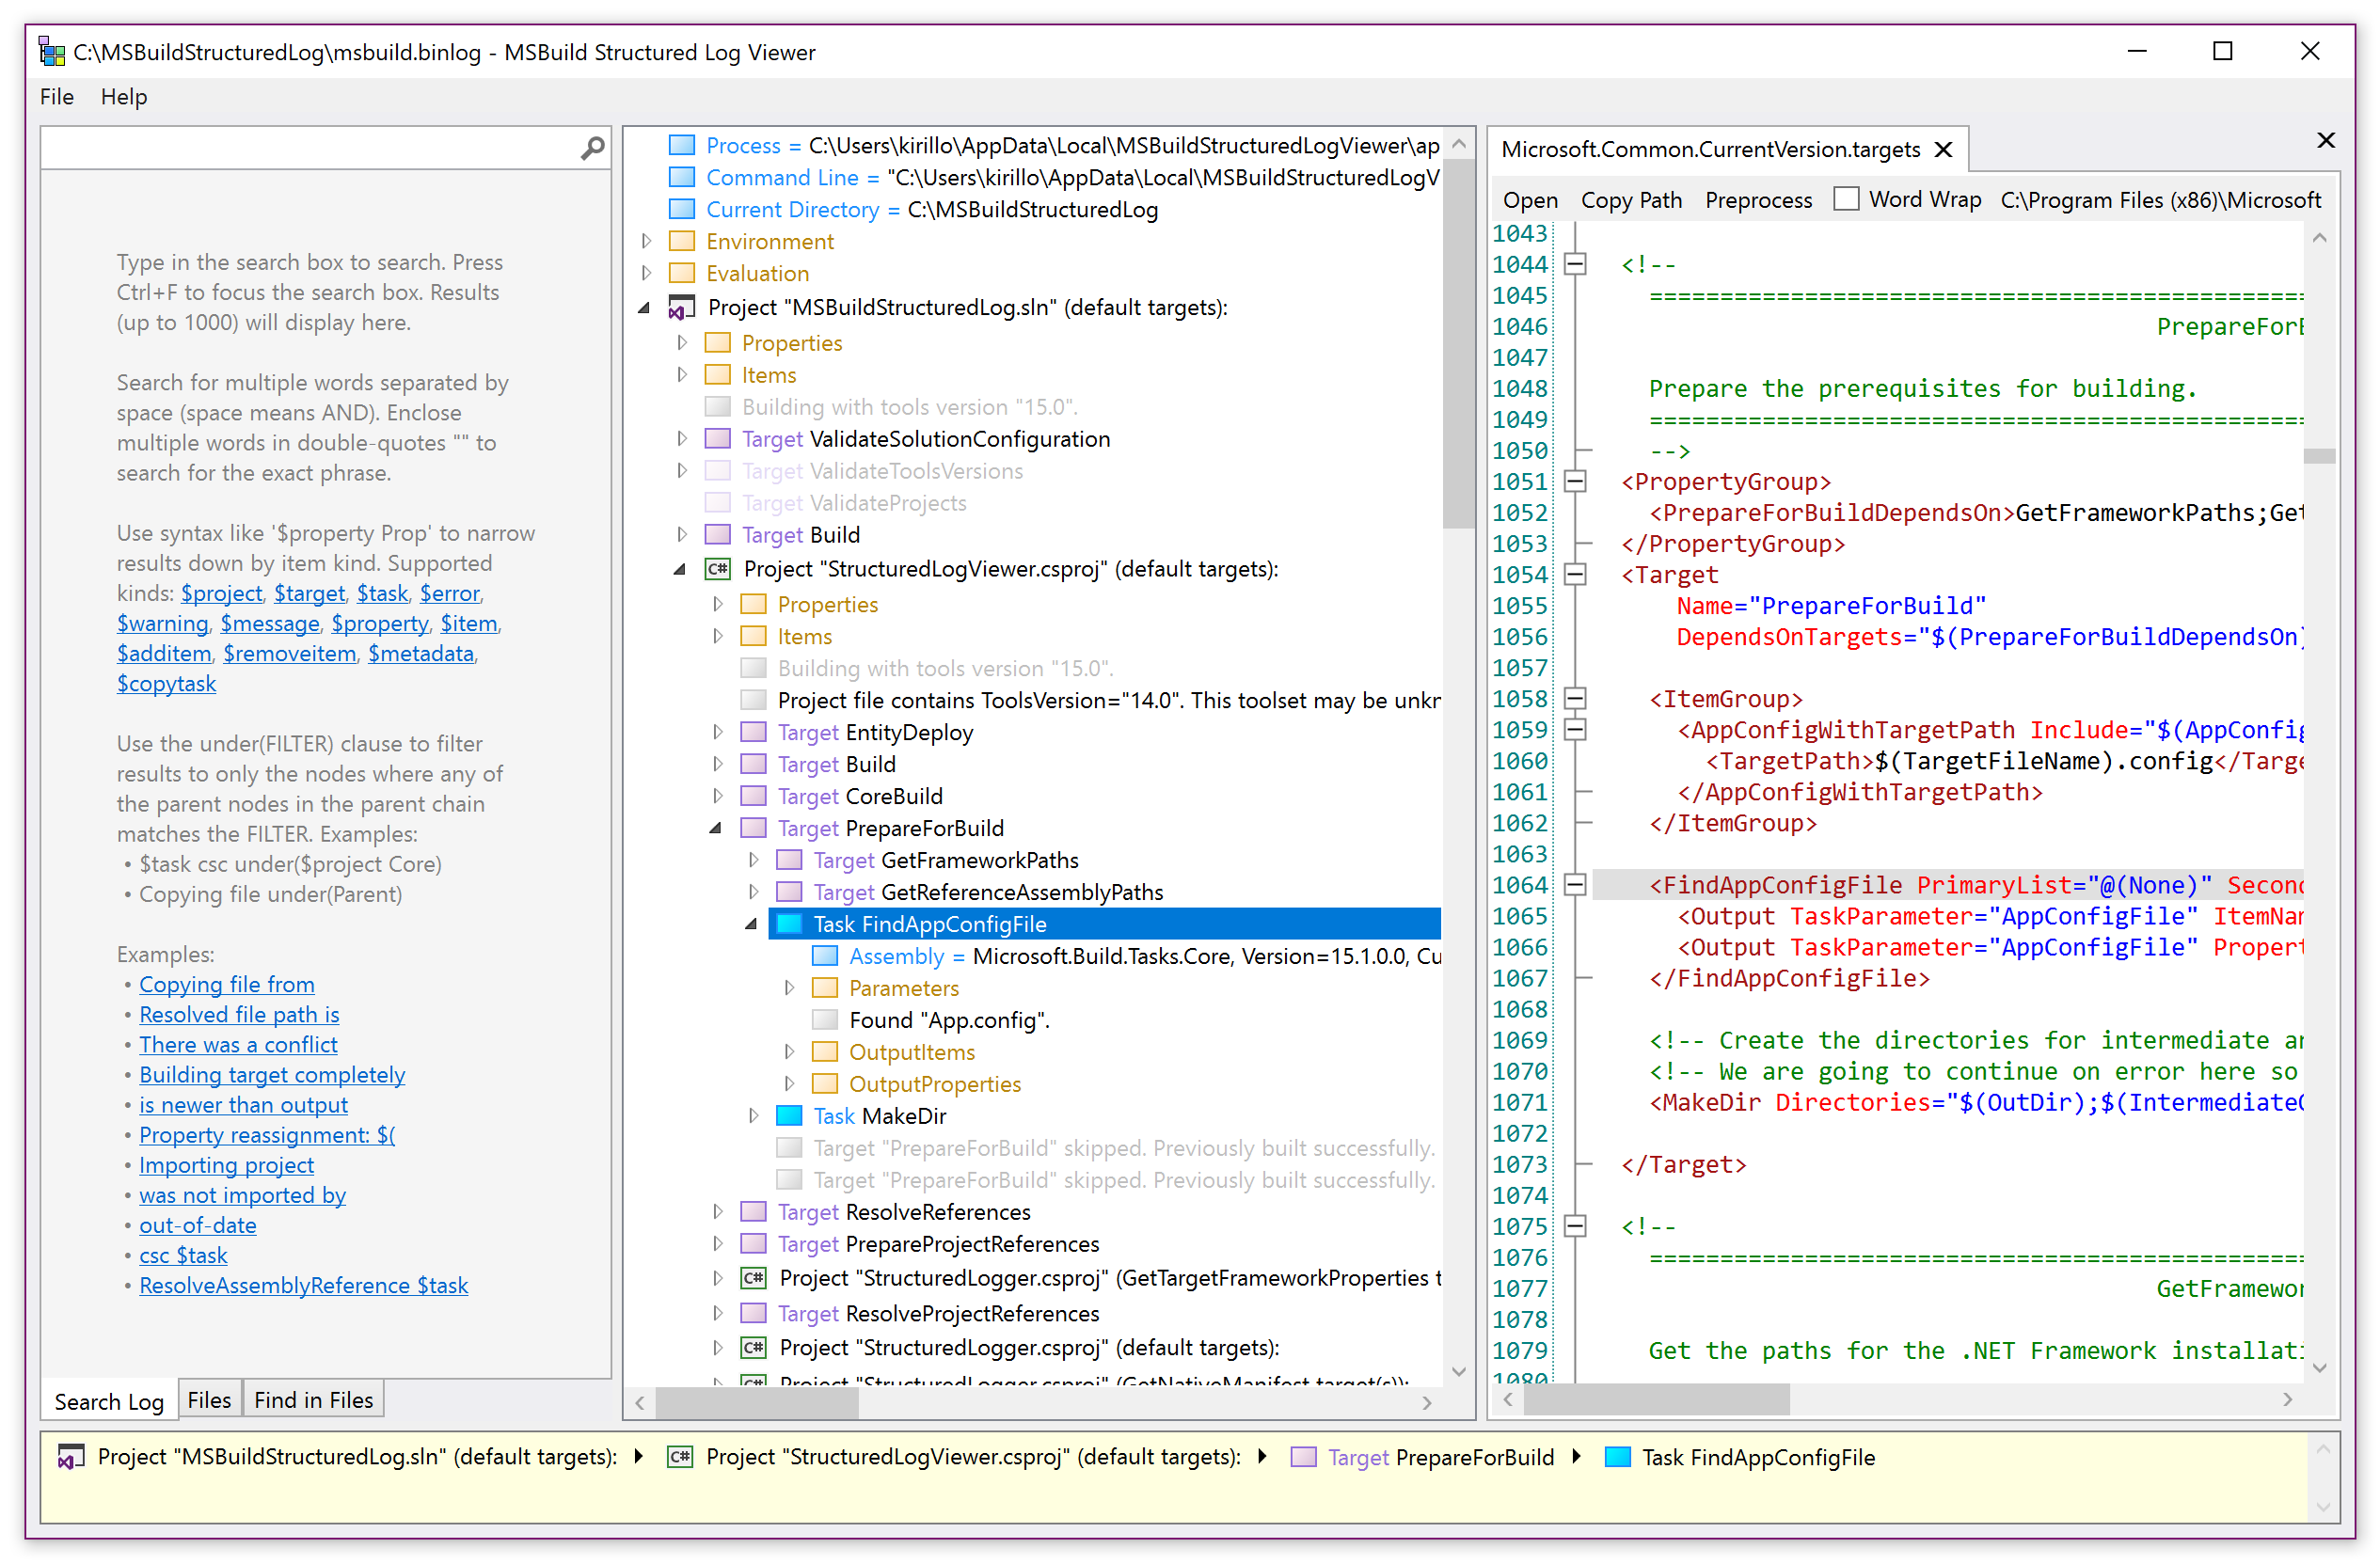
The way it works is that it will list all MSBuild targets, even the ones skipped (shown in gray), so you really see all the steps taken and in which order.
Installing
My preferred method to install most applications on Windows these days is to use winget, the official Windows Package Manager. If you’re on Windows 11 or a new-ish version of Windows 10, you don’t have to do anything as winget is already installed.
winget install KirillOsenkov.MSBuildStructuredLogViewer
If you prefer a good old installer executable, you can also find that on their GitHub Release page.
Running
You can either collect the binary log yourself or open a solution from within MSBuild Structured Log Viewer itself. To capture the binary log on your own, you need to append -bl or -binaryLogger to the build command:
dotnet build MySolution.sln -bl
This will generate a msbuild.binlog file in the working directory. If you prefer a different location, you can provide it as parameter to the flag:
dotnet build MySolution.sln -bl:custom/path/output.binlog
Note: This is an MSBuild feature, and not part of dotnet build or the MSBuild Structure Log Viewer.
Now open the generated *.binlog file in the log viewer.
Build Time
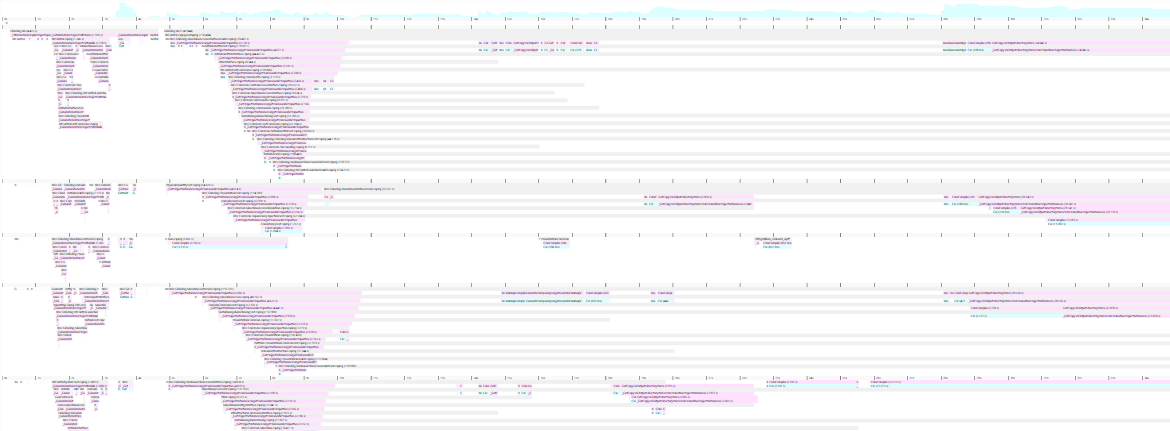
Since each target is tracked over time, it’s pretty simple to get an overview of where most of the time is spent. Using the Timeline view, you can at a glance spot which part of the build process took the longest:
For the screenshot above you can see a long pink streak, which is actually the ResolveProjectReferences that seems to take quite a while.
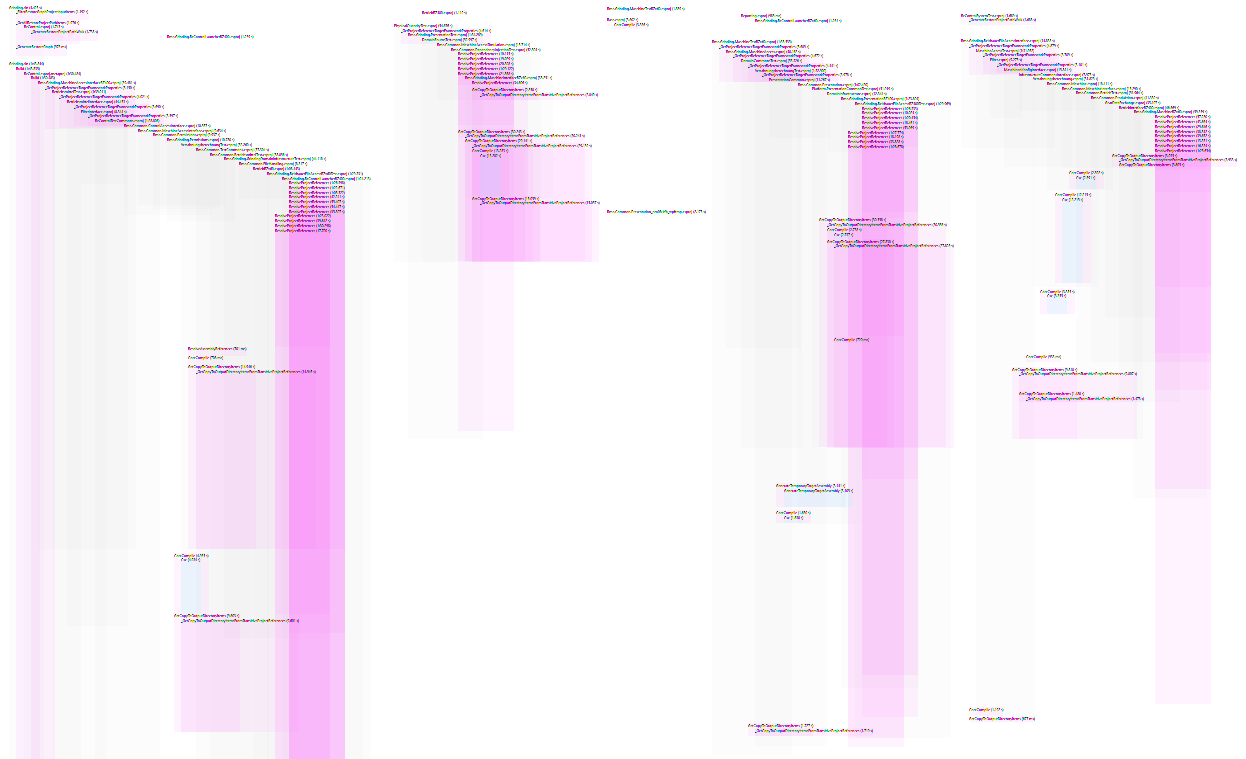
With the tracing view, shows the same data in a slightly different format, which might help you even more to drill down on a specific slow build step.
Double Writes
One interesting feature, especially if you write to a shared output directory, is to detect double writes, meaning when an assembly with the same name is written multiple times to the same output directory.
This can happen for example, when you have different version of the same NuGet package referenced in different projects, or different NuGet packages have implicit dependencies with different versions. This can cause issues as you end up in a race condition of whatever project is built last, which overwrites the previous version and thus “wins”.
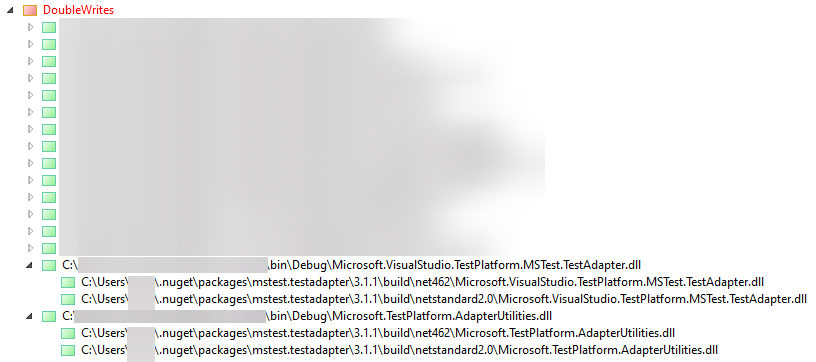
The double write in this screenshot is due to a mix of .NET Framework and .NET Standard projects, which ends up with two different versions of MSTest.TestAdapter being written to the same output directory. If the netstandard version is written last, it can lead to odd errors of missing methods.
There are plenty more features to MSBuild Structured Log Viewer, but I’ve only mentioned double writes, as it has saved me a bunch of times in the past.
One thought on “Analyze Build Time with MSBuild Log Viewer”